

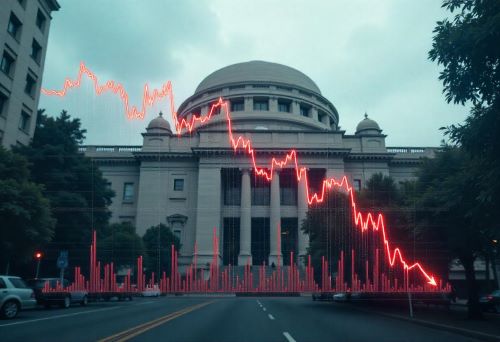
The cryptocurrency market is heating up as Bitcoin (BTC) smashes past its all-time high, Ethereum (ETH) crosses the $3,000 mark, and Ripple’s XRP continues its bullish rally toward the $3 threshold. With strong bullish momentum gripping the crypto sector,

investors and traders are closely watching the top three cryptocurrencies for potential breakout moves.
Bitcoin Price Surges Past $121K: New All-Time High Achieved
BTC enters price discovery mode
Bitcoin, the world’s largest cryptocurrency by market cap, broke a new record on Monday by hitting $121,492, surpassing its previous high of $111,980. The ongoing rally shows signs of strong investor confidence and increasing institutional interest.
Technical indicators support bullish trend
- Bitcoin price currently trades nearly 2% higher on the day.
- It has successfully broken above the 61.8% Fibonacci retracement level at $121,357.
- RSI (Relative Strength Index) stands at 77, indicating overbought conditions.
- MACD (Moving Average Convergence/Divergence) shows strong bullish momentum with green histogram bars rising above the zero line.
BTC Price Targets and Support Zones
- If Bitcoin maintains a daily close above $121,357, the next target could be the 78.6% Fibonacci level at $127,652.
- In case of a reversal, BTC could find support at the 50% Fibonacci level at $116,936.
Key Bitcoin Takeaways:
- 📈 All-time high: $121,492
- 🎯 Next resistance: $127,652
- 🛑 Support level: $116,936
- 🔍 Indicators: RSI at 77, MACD shows bullish strength
Ethereum Crosses $3,000: Bulls Eye $3,525
ETH gains over 2%, golden crossover in play
Ethereum continues its upward movement, trading above $3,000 for the first time in five months. The bullish sentiment around ETH is further fueled by a golden crossover, where the 50-day EMA crosses above the 200-day EMA — a classic bullish signal.
Ethereum’s Technical Outlook
- The 61.8% Fibonacci retracement level at $3,067 is now within reach.
- RSI currently reads 74, reflecting strong buying pressure.
- MACD histogram bars continue to expand in the positive territory.
ETH Price Prediction and Support
- A breakout above $3,067 may drive ETH to the next target of $3,525, based on Fibonacci levels.
- In the case of a pullback, Ethereum could retest the 50% level at $2,746.
Key Ethereum Takeaways:
- 🚀 Current price: Above $3,000
- 🎯 Next target: $3,525
- 📉 Possible support: $2,746
- 🔍 Indicators: RSI at 74, bullish MACD crossover
XRP Bullish Rally Continues: Eyes Set on $3 Breakout
Ripple’s XRP rises 3% as breakout intensifies
Ripple’s XRP extends its impressive rally, adding more than 3% gains on Monday after a strong 24% weekly increase. The price action confirms a breakout above a descending resistance trendline drawn from the January 16 and May 12 highs.
XRP Technical Analysis:
- XRP is approaching a major resistance at $2.99, last seen on March 2.
- A daily close above $2.99 may extend the rally toward $3.29, a level last tested on January 20.
- RSI is at 83, signaling extreme overbought conditions.
- MACD still indicates continued bullish momentum.
Support Level to Watch
- On the downside, a reversal could send XRP to retest the $2.65 support, last touched on Saturday.
Key XRP Takeaways:
- 🔼 Current trend: Bullish continuation
- 💹 Resistance levels: $2.99 and $3.29
- 🔻 Support zone: $2.65
- 📊 Indicators: RSI at 83, MACD remains bullish
Crypto Market Outlook: More Gains Ahead?
The overall market sentiment for cryptocurrencies remains bullish as major coins continue to post gains amid strong technical indicators and institutional inflows.
Reasons Behind the Rally:
- Institutional buying and ETF inflows into Bitcoin and Ethereum.
- Macroeconomic easing expectations with potential rate cuts ahead.
- Bullish technical formations like golden crosses and trendline breakouts.
- Increased retail participation and FOMO buying (Fear of Missing Out).
Conclusion: What to Expect Next in BTC, ETH, XRP
The price action in Bitcoin, Ethereum, and Ripple’s XRP signals a potential extended bull run if current momentum holds. Traders and long-term investors should monitor key resistance and support levels while considering overbought conditions on RSI.
Top Crypto Forecast Summary:
| Crypto | Resistance Target | Support Zone | RSI | MACD |
|---|---|---|---|---|
| BTC | $127,652 | $116,936 | 77 | Bullish |
| ETH | $3,525 | $2,746 | 74 | Bullish |
| XRP | $3.29 | $2.65 | 83 | Bullish |
While short-term corrections may occur, the mid-to-long-term trend remains upward for all three major coins.
FAQs: Bitcoin, Ethereum, XRP Price Predictions
Is it a good time to invest in Bitcoin now?
Bitcoin is in price discovery mode with new highs, but RSI suggests overbought levels. Entry on dips could be considered.
Will Ethereum reach $4,000 soon?
If Ethereum sustains above $3,067, a move towards $3,525 and then $4,000 is likely.
Can XRP break above $3?
A strong daily close above $2.99 could take XRP above $3, with the next resistance near $3.29.
Bitcoin Price Prediction: BTC Hits $122K as ETF Inflows and Geopolitical Risk Trigger Breakout Rally
Bitcoin (BTC) has soared past $122,000, marking a multi-week high and confirming a decisive breakout after a brief consolidation near $118K. The bullish surge is fueled by strong ETF inflows, institutional buying,
and geopolitical uncertainties sparked by U.S. tariff announcements. Traders and analysts are now targeting the $125K to $130K resistance zone, while strong support remains near the $114K–$118K levels.
📈 Bitcoin Breakout: BTC Price Analysis and Forecast

The Bitcoin price today stands at $122,194, with bullish technical indicators supporting the ongoing rally. After resolving a textbook bull flag on both the daily and 4-hour charts, Bitcoin has broken out of a critical resistance zone and is now trading comfortably above all major moving averages.
BTC Forecast Table – July 15, 2025
| Indicator/Zone | Level / Signal |
|---|---|
| Bitcoin Price | $122,194 |
| Resistance 1 | $125,500 |
| Resistance 2 | $130,000 |
| Support 1 | $118,200 |
| Support 2 | $114,000 |
| RSI (30-min) | 68.3 (Cooling from Overbought) |
| MACD (30-min) | Bullish with Rising Histogram |
| Bollinger Bands (4H) | Expanded, Volatility Breakout |
| EMA Cluster (4H) | 20/50/100/200 EMAs Below Price |
| Supertrend (1D) | Bullish Above $112,357 |
| DMI (1D) | +DI Dominates, ADX Rising |
| ETF Net Inflows (24H) | +$309 Million |
| Open Interest | $88.22 Billion (+6.4%) |
| Volume (24H) | $115.6 Billion (+123%) |
🌍 Why Is Bitcoin Price Going Up Today?
Several key factors have converged to push BTC price higher, including:
1. Surging ETF Inflows
- Bitcoin ETF inflows reached $309 million in 24 hours on July 14.
- This marks the highest single-day inflow since March 2025.
- Institutions are actively accumulating BTC, signaling long-term bullish sentiment.
2. Geopolitical Tensions Spark Crypto Hedging
- Former U.S. President Donald Trump announced 30% tariffs on EU and Mexico, effective August 1.
- Investors are increasingly turning to Bitcoin as a hedge against economic and geopolitical instability.
3. Derivatives Market Supports Bullish Momentum
- Open interest in Bitcoin futures has surged 6.4% to $88.22B.
- Trading volume spiked by 123%, crossing the $115 billion mark.
- Long/short ratio on Binance shows 1.83 long bias, favoring bullish positions.
📊 Bitcoin Technical Analysis: Indicators Confirm Breakout
Bitcoin’s rally is strongly supported by multiple technical indicators suggesting that the uptrend is not only real but could continue in the coming sessions.
✅ MACD and RSI Indicate Strong Momentum
- The MACD on the 30-minute and 4-hour chart is bullish with expanding green histograms.
- RSI peaked at 78.9 before cooling to 68.3, allowing room for a fresh leg upward.
✅ EMA and Supertrend Signals Are Strongly Bullish
- BTC is currently trading above the 20/50/100/200 EMAs, indicating robust support beneath current levels.
- The Supertrend indicator has flipped bullish above $112,357, further confirming the trend.
✅ Bollinger Bands Suggest Volatility Breakout
- The Bollinger Bands on the 4-hour chart are expanding, with the price pushing against the upper band near $122K.
- This is a classic volatility breakout pattern, signaling room for continuation.
🧠 Smart Money Concepts (SMC): Structure Break Confirmed
On the weekly chart, Bitcoin has confirmed a Break of Structure (BOS) above $120,000, invalidating the previous Change of Character (CHoCH) at $108K.
📌 Key Structural Points:
- BOS above $120K confirms bullish continuation.
- Previous liquidity zone between $103K–$108K now acts as strong support.
- BTC has cleared weak highs and is now aiming for higher liquidity zones near $125K.
⚡ DMI and Dominance Chart: Strong Trend Confirmation
The Directional Movement Index (DMI) on the daily chart reinforces a bullish trend:
- +DI (40.86) significantly leads -DI (22.79).
- ADX (10.39) is rising, signaling a strong trending phase.
💹 Bitcoin Dominance Nearing Breakout
- BTC dominance is approaching 65%, nearing the apex of a multi-year symmetrical triangle.
- A breakout could trigger rotation away from altcoins into Bitcoin, adding more fuel to the BTC rally.
💡 Bitcoin Price Outlook: What’s Next?
With Bitcoin now trading over $122K, traders are eyeing the next resistance levels:
🔺 Upside Targets
- $125,500 (short-term resistance)
- $130,000 (psychological and technical resistance)
🔻 Downside Support
- $118,200 (first strong support)
- $114,000 (previous breakout zone)
- $112,357 (Supertrend flip level)
📈 Investor Sentiment Remains Bullish
- Institutional demand continues to grow.
- Retail traders are entering on breakout confirmations.
- The macro environment supports long-term accumulation.
📝 Conclusion: Bitcoin Enters a New Bullish Phase
The recent breakout of Bitcoin above $122,000 is not just a technical rally — it’s backed by strong fundamentals, institutional accumulation, and a supportive macroeconomic backdrop. With resistance zones now shifting to $125K–$130K, the outlook remains bullish, though some intraday corrections may occur.
❓ FAQs: Bitcoin Price Prediction and Technical Outlook
🔹 Will Bitcoin hit $130,000 soon?
Yes, if BTC holds above $122K and breaks $125.5K resistance, the path toward $130K becomes highly probable.
🔹 Why did Bitcoin’s price rise today?
Primarily due to ETF inflows, tariff-related geopolitical risk, and bullish derivatives market data.
🔹 Is this a good time to buy Bitcoin?
Momentum indicators are bullish, but RSI suggests short-term caution. Consider buying on dips for better entry points.
Bitcoin Price Prediction 2025, 2026 – 2030: How High Will BTC Go?
Current Bitcoin Price: $116,792
With the second half of 2025 underway, Bitcoin has once again entered a price discovery mode, breaching previous all-time highs and making headlines across the globe. Investors, institutions, and crypto enthusiasts are now eyeing what’s next for BTC, and the predictions are nothing short of explosive.
Let’s dive into the detailed analysis of Bitcoin price predictions for 2025 and beyond.
📈 Bitcoin’s Meteoric Rise in 2025: What Sparked It?
BTC Hits All-Time High in July 2025
As of mid-July 2025, Bitcoin smashed its previous record of $112K to reach a new all-time high (ATH) of $123,231. This surge was triggered by:
- Massive institutional buying
- Whale accumulation
- Increased ETF inflows
- Regulatory clarity in the U.S. and Europe
- Political support from President Trump
- Market anticipation of Federal Reserve rate cuts
Bitcoin is now trading near $116,792, with analysts projecting further upside in the coming weeks.
💹 Bitcoin Price Prediction July 2025
July has seen unprecedented momentum. From a bullish technical breakout to a revival in on-chain whale activity, everything is pointing toward a strong upward trend.
Key Factors Driving July Rally:
- Whale transactions above $100K and $1M surge sharply
- Spot trading volume hits 3-month high
- Dormant BTC wallets reactivated, signaling long-term confidence
- Breakout from bullish flag pattern
Technical Outlook for July 2025:
| Level | Value |
|---|---|
| Resistance | $122,000 – $125,000 |
| Support 1 | $120,000 |
| Support 2 | $110,000 |
| Final Support | $101,000 |
📊 Bitcoin Price Prediction for 2025 (Year-End Outlook)
Despite geopolitical volatility in H1 2025, Bitcoin’s long-term outlook for 2025 remains bullish. The price fluctuations caused by tensions in Ukraine-Russia and Israel-Iran temporarily shook market sentiment, but BTC showed strong recovery patterns each time.
Bitcoin 2025 Forecast:
| Timeframe | Potential Low | Potential Average | Potential High |
|---|---|---|---|
| July 2025 | $95,000 | $103,500–$108,000 | $120,000 |
| Q4 2025 | $110,000 | $135,000 | $175,000 |
Why Analysts Expect a Rally in H2 2025:
- U.S. Federal Reserve may announce rate cuts
- ETF adoption by pension funds and institutions
- Political narrative shifts towards BTC as “inflation hedge”
- Ongoing de-dollarization drives BTC demand globally
🌐 Macro Factors Supporting Bitcoin’s Bull Run
1. Institutional Adoption at Record High
Major corporations like MicroStrategy, Trump Media, Metaplanet, and several hedge funds are adding BTC to their balance sheets.
2. Bitcoin ETFs Fuel Market Entry
Since the approval of multiple spot Bitcoin ETFs, investment from retail and institutional investors has significantly increased. These ETFs have added over $40 billion in cumulative BTC exposure by mid-2025.
3. Political and Regulatory Tailwinds
- President Trump has declared support for crypto innovation
- U.S. regulators have created a clear crypto compliance framework
- India and UAE are working on crypto taxation reforms, making it easier for retail investors to participate
🌍 Bitcoin Price Prediction 2026 – 2030
Bullish Momentum to Continue?
Based on on-chain data, adoption curves, and historical bull market cycles, Bitcoin could experience massive growth heading into the next halving cycle in 2028.
Long-Term BTC Forecast:
| Year | Potential Low | Potential Average | Potential High |
|---|---|---|---|
| 2026 | $150,000 | $175,000 | $210,000 |
| 2027 | $190,000 | $230,000 | $270,000 |
| 2028 | $250,000 | $300,000 | $400,000 |
| 2029 | $350,000 | $480,000 | $600,000 |
| 2030 | $550,000 | $700,000 | $900,000 |